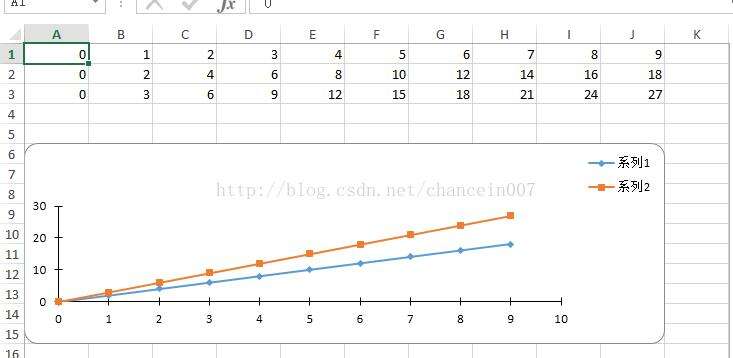
有的时候,我们需要Excel中的数据,通过一个图画,可视化的表现出来。 那么这个时候,应该如何做呢?现在就借花献佛,以Apache POI自己提供的一个例子为例,给大家演示一下POI的API 如何画图的。下面是一个最终的效果...

有的时候,我们需要Excel中的数据,通过一个图画,可视化的表现出来。 那么这个时候,应该如何做呢?现在就借花献佛,以Apache POI自己提供的一个例子为例,给大家演示一下POI的API 如何画图的。下面是一个最终的效果图。然后分别给大家解释每段代码的作用和意义。

代码如下,
import java.io.FileOutputStream;
import org.apache.poi.ss.usermodel.*;
import org.apache.poi.ss.util.*;
import org.apache.poi.ss.usermodel.charts.*;
import org.apache.poi.xssf.usermodel.XSSFWorkbook;
/**
* Illustrates how to create a simple scatter chart.
*
* @author Roman Kashitsyn
*/
public class ScatterChart {
public static void main(String[] args) throws Exception {
Workbook wb = new XSSFWorkbook();
Sheet sheet = wb.createSheet("Sheet 1");
final int NUM_OF_ROWS = 3;
final int NUM_OF_COLUMNS = 10;
// Create a row and put some cells in it. Rows are 0 based.
Row row;
Cell cell;
for (int rowIndex = 0; rowIndex < NUM_OF_ROWS; rowIndex++) {
row = sheet.createRow((short) rowIndex);
for (int colIndex = 0; colIndex < NUM_OF_COLUMNS; colIndex++) {
cell = row.createCell((short) colIndex);
cell.setCellValue(colIndex * (rowIndex + 1));
}
}
Drawing drawing = sheet.createDrawingPatriarch();
ClientAnchor anchor = drawing.createAnchor(0, 0, 0, 0, 0, 5, 10, 15);
Chart chart = drawing.createChart(anchor);
ChartLegend legend = chart.getOrCreateLegend();
legend.setPosition(LegendPosition.TOP_RIGHT);
ScatterChartData data = chart.getChartDataFactory().createScatterChartData();
ValueAxis bottomAxis = chart.getChartAxisFactory().createValueAxis(AxisPosition.BOTTOM);
ValueAxis leftAxis = chart.getChartAxisFactory().createValueAxis(AxisPosition.LEFT);
leftAxis.setCrosses(AxisCrosses.AUTO_ZERO);
ChartDataSource<Number> xs = DataSources.fromNumericCellRange(sheet, new CellRangeAddress(0, 0, 0, NUM_OF_COLUMNS - 1));
ChartDataSource<Number> ys1 = DataSources.fromNumericCellRange(sheet, new CellRangeAddress(1, 1, 0, NUM_OF_COLUMNS - 1));
ChartDataSource<Number> ys2 = DataSources.fromNumericCellRange(sheet, new CellRangeAddress(2, 2, 0, NUM_OF_COLUMNS - 1));
data.addSerie(xs, ys1);
data.addSerie(xs, ys2);
chart.plot(data, bottomAxis, leftAxis);
// Write the output to a file
FileOutputStream fileOut = new FileOutputStream("ooxml-scatter-chart.xlsx");
wb.write(fileOut);
fileOut.close();
}
}下面逐一来分解:
1.下面的代码新建一个工作簿和工作表单的对象
Workbook wb = new XSSFWorkbook();
Sheet sheet = wb.createSheet("Sheet 1");
2.下面这段代码是用生成初始化数据的,总共的数据有3行10列。
final int NUM_OF_ROWS = 3;
final int NUM_OF_COLUMNS = 10;
// Create a row and put some cells in it. Rows are 0 based.
Row row;
Cell cell;
for (int rowIndex = 0; rowIndex < NUM_OF_ROWS; rowIndex++) {
row = sheet.createRow((short) rowIndex);
for (int colIndex = 0; colIndex < NUM_OF_COLUMNS; colIndex++) {
cell = row.createCell((short) colIndex);
cell.setCellValue(colIndex * (rowIndex + 1));
}
}

3. 下面这段代码设置了画图的区域:从第5行开始,到15行结束;总共占用10列
Drawing drawing = sheet.createDrawingPatriarch();
ClientAnchor anchor = drawing.createAnchor(0, 0, 0, 0, 0, 5, 10, 15);
4.创建一个离散图的坐标系
Chart chart = drawing.createChart(anchor);
ChartLegend legend = chart.getOrCreateLegend();
legend.setPosition(LegendPosition.TOP_RIGHT);
ScatterChartData data = chart.getChartDataFactory().createScatterChartData();
ValueAxis bottomAxis = chart.getChartAxisFactory().createValueAxis(AxisPosition.BOTTOM);
ValueAxis leftAxis = chart.getChartAxisFactory().createValueAxis(AxisPosition.LEFT);
leftAxis.setCrosses(AxisCrosses.AUTO_ZERO);
5.往离散图上填充数据
ChartDataSource<Number> xs = DataSources.fromNumericCellRange(sheet, new CellRangeAddress(0, 0, 0, NUM_OF_COLUMNS - 1));
ChartDataSource<Number> ys1 = DataSources.fromNumericCellRange(sheet, new CellRangeAddress(1, 1, 0, NUM_OF_COLUMNS - 1));
ChartDataSource<Number> ys2 = DataSources.fromNumericCellRange(sheet, new CellRangeAddress(2, 2, 0, NUM_OF_COLUMNS - 1));
data.addSerie(xs, ys1);
data.addSerie(xs, ys2);
其中,下面的方法定义
DataSources.fromNumericCellRange(sheet, new CellRangeAddress(0, 0, 0, NUM_OF_COLUMNS - 1));
如下,
public static ChartDataSource<Number> fromNumericCellRange(Sheet sheet, CellRangeAddress cellRangeAddress)
从上面可以看出,其实填充数据的关键方法是,
<pre name="code" class="java">new CellRangeAddress(0, 0, 0, NUM_OF_COLUMNS - 1)
那么这个方式是如何定义的呢?
public CellRangeAddress(int firstRow, int lastRow, int firstCol, int lastCol)
从上面可以看出,其让我们制定数据是从那一行开始的,那一行结束的,那一列开始的,那一列结束。
在上面的代码的5句话中,分别把第1行的1到10列做为基准,然后把第2行的1到10列做一个比较,画出曲线系列1
把第1行的1到10列做为基准,然后把第3行的1到10列做一个比较,画出曲线系列2
6. 开始画图
chart.plot(data, bottomAxis, leftAxis);
7. 保存成一个Excel文件
FileOutputStream fileOut = new FileOutputStream("ooxml-scatter-chart.xlsx");
wb.write(fileOut);
fileOut.close();
原文:http://blog.csdn.net/chancein007/article/details/46242685
本文标题为:(7) 如何用Apache POI操作Excel文件-----如何用Apache POI 画一个离散图


- 阿里云ECS排查CPU数据分析 2022-10-06
- 教你在docker 中搭建 PHP8 + Apache 环境的过程 2022-10-06
- 解决:apache24 安装后闪退和配置端口映射和连接超时设置 2023-09-11
- 【转载】CentOS安装Tomcat 2023-09-24
- CentOS7安装GlusterFS集群的全过程 2022-10-10
- nginx中封禁ip和允许内网ip访问的实现示例 2022-09-23
- KVM虚拟化Linux Bridge环境部署的方法步骤 2023-07-11
- CentOS_mini下安装docker 之 安装docker CE 2023-09-23
- 利用Docker 运行 python 简单程序 2022-10-16
- IIS搭建ftp服务器的详细教程 2022-11-15


