这篇文章主要为大家详细介绍了C#绘制实时曲线的方法,文中示例代码介绍的非常详细,具有一定的参考价值,感兴趣的小伙伴们可以参考一下
本文实例为大家分享了C#绘制实时曲线的具体代码,供大家参考,具体内容如下
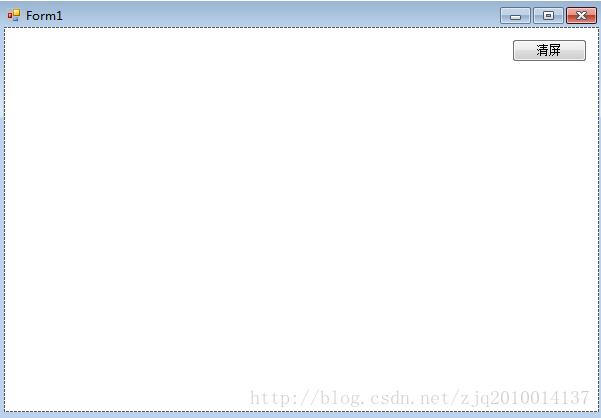
1.要做一个调试工具,采集传感器数据并显示。绘制曲线注意坐标反转,线条的张力即可。项目中的曲线是从右往左显示的,线条的坐标都放在list里了,效果如下图:
2.上代码
public class DrawingCurve
    {
        private Graphics graphics; //Graphics 类提供将对象绘制到显示设备的方法
        private Bitmap bitmap; //位图对象
        private int timeLine = 60;//60s
        private int canvasWidth = 600;//画布长度
        private int sliceCount = 0;//刻度分段个数 = timeLine
        private int xSlice = 10;//X轴刻度分端宽度
        private int xSliceHeight = 10;//X轴刻度高度
        private float tension = 0.5f; //张力系数
        private bool showX = true;
        private bool showY = true;
        private bool showZ = true;

        //Queue<PointF> que = new Queue<PointF>();//曲线fifo
        /// <summary>
        /// 构造函数
        /// </summary>
        public DrawingCurve() {
            this.xSlice = this.canvasWidth / timeLine;
        }

        /// <summary>
        /// 绘制画布
        /// </summary>
        /// <param name="width"></param>
        /// <param name="height"></param>
        /// <param name="points"></param>
        /// <returns></returns>
        public Bitmap DrawCanvas(int width, int height,List<float> points)
        {
            if (bitmap != null)
            {
                bitmap.Dispose();
                bitmap = null;
            }

            bitmap = new Bitmap(width, height);
            graphics = Graphics.FromImage(bitmap);
            graphics.FillRectangle(Brushes.Black, new Rectangle(0, 0, width, height));
            graphics.Transform = new Matrix(1, 0, 0, -1, 0, 0);//Y轴向上为正,X向右为
            graphics.TranslateTransform(0, height / 2, MatrixOrder.Append);

            Pen pen = new Pen(Color.Red, 1);
            pen.DashStyle = DashStyle.Custom;
            pen.DashPattern = new float[] { 2, 2 };
            graphics.DrawLine(pen, new Point(0, height / 4), new Point(width, height / 4));
            graphics.DrawLine(pen, new Point(0, height / -4), new Point(width, height / -4));
            graphics.DrawLine(new Pen(Color.GreenYellow,1), new Point(0, 0), new Point(width, 0));
            graphics.DrawString("0", new Font("Vendara",10), Brushes.White, new Point(0, -15));
            graphics.DrawString("+", new Font("Vendara", 10), Brushes.White, new Point(0, height / 4));
            graphics.DrawString("-", new Font("Vendara", 10), Brushes.White, new Point(0, height / -4-15));
            graphics.Transform = new Matrix(1, 0, 0, 1, 0, 0);//Y轴向上为正,X向右为
            graphics.TranslateTransform(0, height / 2, MatrixOrder.Append);
            graphics.DrawString("-59s", new Font("Vendara", 8), Brushes.White, new Point(0, height/2-15));
            graphics.DrawString("0s", new Font("Vendara", 8), Brushes.White, new Point(width-20, height / 2 - 15));
            for (int i = 0; i < timeLine; i++)
            {
                int scale = i * xSlice;
                graphics.DrawLine(new Pen(new SolidBrush(Color.Blue)), 0 + scale, 0 + xSliceHeight * 0.1f, 0 + scale, 0 - xSliceHeight * 0.1f);
            }

            graphics.Transform = new Matrix(-1, 0, 0, -1, 0, 0);//Y轴向上为正,X向右为
            graphics.TranslateTransform(width, height / 2, MatrixOrder.Append);

            if (showX) DrawX(graphics, points);
            if (showY) DrawY(graphics, points);
            if (showZ) DrawZ(graphics, points);
            graphics.Dispose();
            return bitmap;
        }

        #region 绘制曲线
        private void DrawX(Graphics graphics, List<float> points)
        {
            Pen CurvePen = new Pen(Color.Cyan, 2);
            PointF[] CurvePointF = new PointF[points.Count];
            float keys = 0;
            float values = 0;
            for (int i = 0; i < points.Count; i++)
            {
                keys = xSlice * i;
                values = 10 * (points[i] / 10);
                CurvePointF[i] = new PointF(keys, values);
            }
            graphics.DrawCurve(CurvePen, CurvePointF, this.tension);
        }

        private void DrawY(Graphics graphics, List<float> points)
        {
            Pen CurvePen = new Pen(Color.Purple, 2);
            PointF[] CurvePointF = new PointF[points.Count];
            float keys = 0;
            float values = 0;
            for (int i = 0; i < points.Count; i++)
            {
                keys = xSlice * i;
                values = 10 * (points[i] / 10);
                CurvePointF[i] = new PointF(keys, values);
            }
            graphics.DrawCurve(CurvePen, CurvePointF, this.tension);
        }

        private void DrawZ(Graphics graphics, List<float> points)
        {
            Pen CurvePen = new Pen(Color.OrangeRed, 2);
            PointF[] CurvePointF = new PointF[points.Count];
            float keys = 0;
            float values = 0;
            for (int i = 0; i < points.Count; i++)
            {
                keys = xSlice * i;
                values = 10 * (points[i] / 10);
                CurvePointF[i] = new PointF(keys, values);
            }
            graphics.DrawCurve(CurvePen, CurvePointF, this.tension);
        }

        /// <summary>
        /// 曲线开关
        /// </summary>
        /// <param name="_xyz"></param>
        /// <param name="show"></param>
        public void HideCurve(string _xyz,bool show) {
            switch (_xyz) {
                case "x":
                    showX = show;
                    break;
                case "y":
                    showY = show;
                    break;
                case "z":
                    showZ = show;
                    break;
                default:
                    break;
            }
        }

        #endregion
    }
3.UI上使用ThreadStart进行调用,根据需要设置休眠时间即可,同时设置pictureBox显示即可。
以上就是本文的全部内容,希望对大家的学习有所帮助,也希望大家多多支持得得之家。
沃梦达教程
本文标题为:C#绘制实时曲线的方法


猜你喜欢
- 在C# 8中如何使用默认接口方法详解 2023-03-29
- Unity Shader实现模糊效果 2023-04-27
- C# 使用Aspose.Cells 导出Excel的步骤及问题记录 2023-05-16
- c# 模拟线性回归的示例 2023-03-14
- Oracle中for循环的使用方法 2023-07-04
- WPF使用DrawingContext实现绘制刻度条 2023-07-04
- 如何使用C# 捕获进程输出 2023-03-10
- .NET CORE DI 依赖注入 2023-09-27
- Unity3D实现渐变颜色效果 2023-01-16
- user32.dll 函数说明小结 2022-12-26